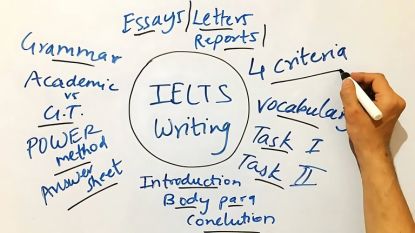
Factual Descriptions may not be a new term for students who are preparing for the crucial IELTS test. Unlike other questions in the varied sections of the four modules, “Factual Descriptions” have gained great importance. It is one of the most vital questions that can help you score well if you attempt it carefully. It is a scoring question and so no one should miss it.
In this post, we will discuss Factual Descriptions in the IELTS exam. We have covered certain essential aspects, tips, the two vital types of graphs, ways to perform, examples with model answers and other relevant information for your better understanding.
Read it carefully to take maximum advantage of the shared information in this useful post. This blog will help you understand
A factual description is an objective presentation of information, without any personal opinions or interpretations. It can be done accurately using appropriate vocabulary and grammar.
Factual Descriptions are an important part of the International English Language Testing System exam, specifically in the Writing section. Under this section, you may be expected to describe a visual representation, such as a graph, chart, or diagram, based on factual information provided in the question paper.
Factual Descriptions are an important part of the International English Language Testing System exam, specifically in the Writing section. Under this section, you may be expected to describe a visual representation, such as a graph, chart, or diagram, based on factual information provided in the question paper.
For example, if you are given a picture of a city street, you would describe what you see in the picture, such as the buildings, the people, the vehicles, and the weather. You would not provide your personal feelings about the picture or make assumptions about what might be happening in the scene. The question demands you present only factual information with correct grammar. In short, the question demands you to stick to the factual details only.
To write an effective factual description, you should practise analysing and interpreting visual representations, as well as using appropriate vocabulary and grammar to convey information clearly and accurately. Pay attention to the organisation and coherence of your description, as well as the accuracy of your data and the relevance of your conclusions.
Keep in mind to begin writing a factual description with an introduction that describes, in brief, the visual representation and its main features. Then, you should provide a clear and concise description of the data, including any trends, patterns, or significant changes. Use accurate and specific language to describe the data, avoiding generalisations or assumptions. Finally, you should conclude your description by summarising the key findings and drawing any necessary conclusions.
Writing Factual Descriptions correctly is not easy. It also needs you to practise and keep certain essentials in your mind. For the same, you can refer to the key things to consider while attempting the questions related to a visual representation.
The importance of Factual Descriptions lies in the fact that they test your ability to accurately convey information in a clear and concise manner. This is a key skill required in various academic and professional contexts, including research, data analysis, and report writing. You need to prepare for this task by practising with different types of visuals and reviewing relevant vocabulary and grammatical structures.
Scoring
Scoring in Factual Descriptions is based on your personal ability to present accurate and relevant information, as well as your use of appropriate grammar, vocabulary, and sentence structures. It is important to note that this task is not a test of creativity, but rather of accuracy and clarity.
Format
Coming to the factual description of the IELTS format, there is not much to talk about it. You are provided with a visual representation and a set of instructions outlining what you are expected to describe. You are then required to write a report, which may include an introduction, overview, and detailed description of the information presented in the visual representation which can be a static graph, a dynamic graph, a pie chart, and other options used for visual representation.
The different vital parts in IELTS report writing for factual description are:
Preparing for the Factual Description IELTS task is important as it can significantly impact your overall score. Remember practice is the key to success. It is also the best option to develop the necessary skills. You should familiarise yourself with different types of visuals and the language used to describe them in a better way. You can refer to some examples and try to practise them multiple times. It may also help you get acquainted with the common grammatical structures, the correct description writing structure or format along with vocabulary related to data analysis and presentation.
Tips are important to score well also in factual descriptions. They can help you present information in a clear, organised, and concise manner. By following the shared tips you can get a boost, help in the preparation, and do well in the related test.
There are varied types of graphs that you may come across in IELTS Writing Task 1. Some of the most common types of graphs include
Now we are going to discuss the two types of graphs – Static Graphs and Dynamic Graphs in detail.
ABOUT STATIC GRAPHS
To excel in IELTS Writing Task 1 factual descriptions, you need to become skilled in analysing and describing static graphs, which represent non-changing data through bar charts, pie charts, or tables. It is crucial to identify important patterns, trends, and disparities while using proper language and grammar to communicate effectively your analysis. By practising these skills, you can boost your confidence and ability to perform well in Task 1 of the IELTS Writing test.
Static graphs in IELTS – The Common Vocabularies
Using the below vocabularies appropriately will make your response more descriptive, accurate and credible. It can thus help you score well in IELTS Writing Task 1.
Here are some common vocabularies that can be helpful in performing well in static graphs:
These five tips can help you perform better in Static graphs:
EXAMPLES RELATED TO STATIC GRAPHS
Static graphs, also known as fixed or stationary graphs, are visual representations of data that show information at a specific point in time or over a limited period. Examples of static graphs include line graphs, bar charts, pie charts, and tables. The factual description example can be of great help to students like you having a firm determination to excel in the test.
Example 1 – Let us assume a pie chart as an example. The pie chart taken as an example is assumed to show the distribution of expenses of a household in the United Kingdom in 2020.
[Household expenses distribution in the UK in 2020 in percentage ]
[Categories – household, transportation, food, and others]
Model Answer
The pie chart illustrates the distribution of expenses of a household in the UK in 2020.
It can be seen in the graph that the maximum expense for the household was housing, accounting for 35% of the total expenses. This was followed by transportation and food, which accounted for 20% and 15%, respectively. The other categories, including healthcare, entertainment, and education, each made up less than 10% of the total expenses.
It is noteworthy that the household spent a significantly larger proportion of their income on housing than on any other category. This suggests that housing costs may be a major financial burden for the household.
In conclusion, the pie chart presents a clear picture of the distribution of expenses of a household in the UK in 2020. The given data highlights the significant proportion of the household’s income that was spent on housing, as well as the relative importance of transportation and food in their overall expenses.
Example 2 – Now let us take an example of a static graph that displays the information related to temperature in a city based in the United Kingdom. The line graph below shows the average temperature in a city in the UK during the varied months of the year.
[The variation in the average temperature in a city in the UK in the 12 months with Jan being lowest and July temperature being the highest]
Model Answer
The line graph illustrates the variation in the average temperature in a city in the UK over a period of 12 months.
The graph here shows that the highest average temperature was recorded in July, at around 22 degrees Celsius, while the lowest average temperature was in the month January, at approximately 5 degrees Celsius. The graph also shows that the temperature increased gradually from January to May, before peaking in July, and then declining gradually until the end of the year.
It is noteworthy that the temperature range between the highest and lowest average temperatures are relatively small, indicating that the climate in this city may be mild and relatively stable throughout the year.
In conclusion, the line graph presents a clear picture of the average temperature variation in a city in the UK over 12 months. The data highlights the highest and lowest average temperatures, as well as the gradual change in temperature throughout the year.
ABOUT DYNAMIC GRAPHS
Dynamic graphs are a common type of graph that you may come across in IELTS Writing Task 1. These graphs show changes in data over time, such as monthly sales figures or yearly population growth rates. There are different types of dynamic graphs, including line graphs, bar graphs, and stacked graphs, each presenting data in its unique way. The factual description examples can aid in making you understand graphs in a better way.
Dynamic Graphs in IELTS – The common vocabularies
Vocabulary plays a crucial role in both writing and speaking. The use of vocabulary also proves a candidate’s ability to use vocabulary right in a paragraph or sentence. You can have a good command of vocabulary too but for the same you are required to practise regularly.
Common vocabulary useful in dynamic graphs types in the IELTS
Using vocabulary appropriately will make your response more descriptive, accurate, and credible. It can ease your path to a higher score in IELTS Writing Task 1.
Here are some common vocabularies that can be useful in describing dynamic graphs in IELTS Writing Task 1:
Dynamic Graphs in IELTS – The Tips for You
It is important to be able to interpret and describe dynamic graphs accurately and efficiently. Understanding the different types of dynamic graphs and their unique features can help develop the skills needed to analyse data, identify trends, and present your findings clearly and effectively. By following these tips, you can improve your skills in analysing and describing dynamic graphs and feel confident in completing Task 1 of the IELTS Writing exam.
Here are the 7 unique tips for performing well in dynamic graphs:
Understand the time frame: Dynamic graphs show data that change over time, so it is important to understand the time frame of the graph, such as hourly, weekly, monthly, or yearly changes.
Identify the trends: Look for patterns and trends in the data, such as increases, decreases, fluctuations, and plateaus. This will help you identify the key features of the graph and compare and contrast the data effectively.
Use specific data: When describing the data, be specific and use precise numbers or percentages whenever possible. This will make your response more accurate and credible.
Use appropriate tenses: Use the appropriate tenses to describe the changes in the data, such as past tense for changes that have already occurred and present tense for ongoing changes.
Group and compare data: Group the data into categories and compare them to each other over time. This will help you identify similarities and differences and provide a more thorough analysis of the data.
Pay attention to the scales: Make sure to pay attention to the scales on the graph, as changes can appear more dramatic or subtle depending on the scale.
Use appropriate language and structure: Use appropriate language and structure to convey your analysis effectively. Use clear and concise sentences, avoid repetition, and use appropriate vocabulary and grammar to ensure your response is well-organized and easy to understand.
EXAMPLES RELATED TO DYNAMIC GRAPHS
Example 1 – Here we have assumed a Line graph as an example in IELTS Writing Task 1. The graph is used to show the changes in the number of international students enrolled in a UK university from 2010 to 2019.
[(Data of Number of international students enrolled in a UK University – 15000 to 27000)]
[(Years – 2010 to 2019)]
Model Answer for the above example –
The line graph illustrates the changes in the number of international students enrolled in a UK university over a period of 10 years, from 2010 to 2019.
As you can see in the graph, there was a steady increase in the number of international students enrolled in the university over the given period. In 2010, the number of international students was around 15,000, which rose gradually to approximately 27,000 in 2019.
The graph shows that the rate of growth in the number of international students was higher in the earlier years, with a more rapid increase between 2010 and 2014. From 2014 to 2016, the growth rate remained stable, with a slight decline in the number of students in 2017, before continuing to increase in the following years.
In conclusion, the line graph presents a clear picture of the changes in the number of international students enrolled in a UK university over a 10-year period. The data indicates a consistent growth in the number of international students, with some variations in the rate of increase over time.
Example 2 – The bar chart below shows the amount of money spent on fast food by teenagers in the UK from 2010 to 2020.
[(Data of money spent on fast food by teenagers in the UK over a period of 10 years – £6 to £12)]
[(Years – 2010 to 2020)]
Model Answer
The bar chart illustrates the changes in the amount of money spent on fast food by teenagers in the UK over a period of 10 years, from 2010 to 2020.
As can be seen from the graph, there was a significant increase in the amount of money spent on fast food by teenagers in the UK over the given period. In 2010, the average amount spent per week was around £6, which rose gradually to approximately £12 in 2020.
The graph shows that the rate of growth in the amount spent on fast food was higher in the earlier years, with a more rapid increase between 2010 and 2015. From 2015 to 2018, the growth rate remained stable, with a slight decline in the amount spent in 2019, before continuing to increase in 2020.
In conclusion, the bar chart presents a clear picture of the changes in the amount of money spent on fast food by teenagers in the UK over a 10-year period. The data indicates a consistent growth in the amount spent on fast food, with some variations in the rate of increase over time.
The above four factual description examples can help you understand the format and effective writing, understand the use of correct vocabulary, sentence structure, and avoid grammatical errors of any type. The aim is to convey a clear and accurate analysis of the given data in each example question keeping key essentials in your mind meant to help you present an impressive report in the test.
The Concluding Thought
To conclude, mastering the art of factual descriptions is an essential skill for success in the IELTS exam. By accurately and objectively presenting visual representations with precision and clarity, you demonstrate your ability to communicate effectively and persuasively. The process of crafting factual descriptions demands a careful approach, emphasising attention to detail and the use of suitable vocabulary and grammar.
Ultimately, the ability to produce an effective factual description relies on a combination of technical proficiency and creativity. By honing your analytical and interpretive skills, and by cultivating a facility for precise and evocative language, you can develop the expertise necessary to excel in this demanding task. With persistence, patience, and a commitment to excellence, you can master the art of factual descriptions and confidently navigate the challenges of the IELTS exam.
If you’re not sure how to explain factual descriptions in the IELTS in an attractive manner, talk to our IELTS experts who can undoubtedly help you crack the IELTS exam in the first attempt. Contact the team at Study Smart Overseas Education to commence your journey to a successful career.